Merhaba,
vCenter Server ve vimtop isimli bu yazımda sizlere vCenter Server’in performansının nasıl inceleneceğini anlatacağım.
vCenter Server 7 ile birlikte Windows vCenter Server artık kullanılmıyor. Artık tamamen VMware’in geliştirmiş olduğu Photon OS işletim sistemine sahip Appliance ile kullanmaya devam ediyoruz. Önceden Windows üzerine kurulu vCenter Server’da perfmon veya task manager’da bulunan performance monitor üzerinden izleyebiliyorsunuz. Ancak vCenter Server 7 ile birlikte artık komple appliance kullanmaya başlayacağımız için bunun performance metric değerleri biraz daha farklı.
Ben bu yazımda sizlere vCenter Server ‘in performans değerlerini anlatacağım. Aynı şekilde ESXi’in performans değerlerini merak ediyorsanız aşağıdaki makalemi inceleyebilirsiniz.

ESXi Server’i incelerken esxtop komutunu kullanıyoruz. vCenter Server’i incelerken de vimtop komutunu kullanıyoruz. Bunun için ilk olarak vCenter Server’a SSH ile bağlanıyoruz. vCenter Server’a SSH ile bağlandıktan sonra vimtop komutunu çalıştırıyoruz.
vCenter Server ve vimtop
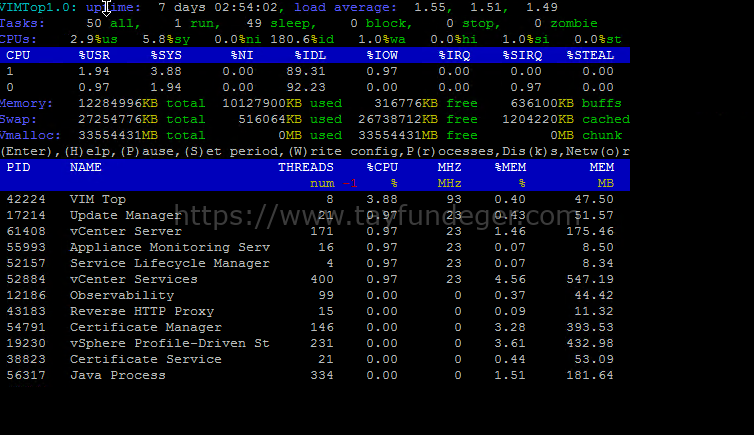
vimtop komutunu ilk olarak çalıştırdığınızda karşınıza yukarıdaki gibi bir ekran gelecektir. Burada varsayılan olarak veriler her saniye yenilenir. esxtop ‘da her 2 saniyede bir veriler yenilenirken burada anlık olarak yenilenir. Eğer siz burada yenilemeyi durdurmak isterseniz p butonuna basabilirsiniz. Yenileme anlık olarak yapıldığı için isterseniz bunu değiştirebilirsiniz. İsterseniz 5 saniye aralık ile yenilenmesini sağlayabilirsiniz. Bunun için s butonuna basıp 5 rakamını girip enter’a basabilirsiniz.
Yardım menüsünü görmek için “h” düğmesine basın. Yardım menüsü vimtop’tan sütunların nasıl ekleneceğini, kaldırılacağını ve yeniden sıralanacağını açıklayacaktır. Vimtop’tan çıkmak için “q” tuşuna basın.
CPU aktivitesi asla % 70’ten fazla olmamalıdır.
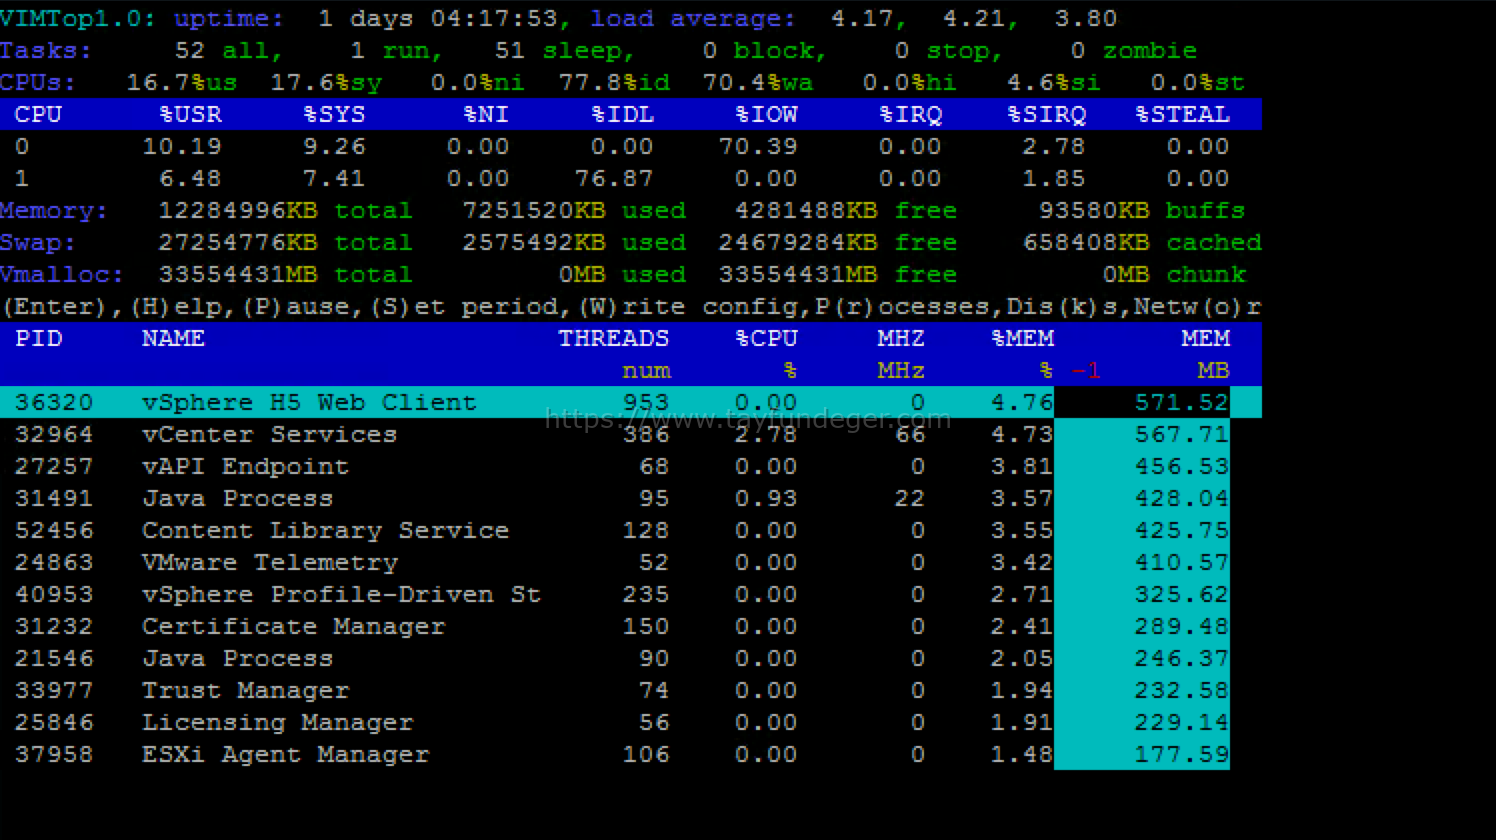
Varsayılan ekranda hem CPU hemde Memory detaylarını görebilirsiniz. Burada isterseniz sıralamayı değiştirebilirsiniz. En çok bellek kullanan işlemleri sıralamak için geçerli olan sıralama düzenini temizlemek için z butonuna basabilirsiniz. Örneğin burada yön tuşlarını kullanarak servisleri highlight edebilrisiniz. Ben mesela yukarıdaki ekranda Memory seçeneğini highlight ettim ve d butonuna basarak en yüksek memory kullanan servise göre sıraladım. d butonuna birkere daha bastığımızda bu sefer en düşük memory tüketen servisi en yukarıda tutar. Siz burada aşağı yukarı ok tuşları ile aşağı yukarı gidebilirsiniz. c butonuna bastığınızda ise karşınıza açılan panelden daha fazla verinin izlenmesini sağlayabilirsiniz. Ekleyebileceğiniz verileri aşağıda görebilirsiniz.
| Column Name | Description |
| PID | Process identifier |
| CMD | Command name used to start the process as it is seen by the under |
| CMDLINE | The full command line of this process, used during startup |
| NAME | User readable name of the process5.16 |
| THREADS | Number of native threads currently running in the process |
| %CPU | Current CPU usage in percent for this process |
| MHZ | Current CPU usage in MHz for this process |
| CPU | Total CPU time used by the process during last measurement cycle |
| SYS | CPU time spent by process in the system (kernel) routines |
| USR | CPU time spent by process in the user land |
| %MEM | Physical memory usage in percent for this process |
| MEM | Physical (resident) memory used by this process |
| VIRT | Total virtual memory size of this process (the complete working set including resident and swapped memory) |
| SHR | Size of the shared code – these are any shared objects (so or DLL) loaded by the process |
| TEXT | Code segment size of the process without any shared libraries |
| DATA | Data segment size of the process (for managed process, like JVM, this includes the managed code also) |
| FD | Total number of file descriptors opened by the process |
| FILS | Number of all file objects opened by the process (sum of files, directories and links) |
| FILE | Number of regular files currently opened by the process |
| DIR | Number of directories currently opened by the process |
| LNK | Number of symbolic links currently opened by the process |
| DEVS | Number of devices (char or block) opened by the process |
| CHAR | Number of descriptors opened to character devices |
| BLCK | Number of descriptors opened to block devices |
| CHNS | Number of all communication channels opened by the process (eithe sockets or FIFOs) |
| SCKS | Number of sockets (TCP, UDP, raw) currently opened by the process |
| FIFO | Pipes (named or not) opened by the process |
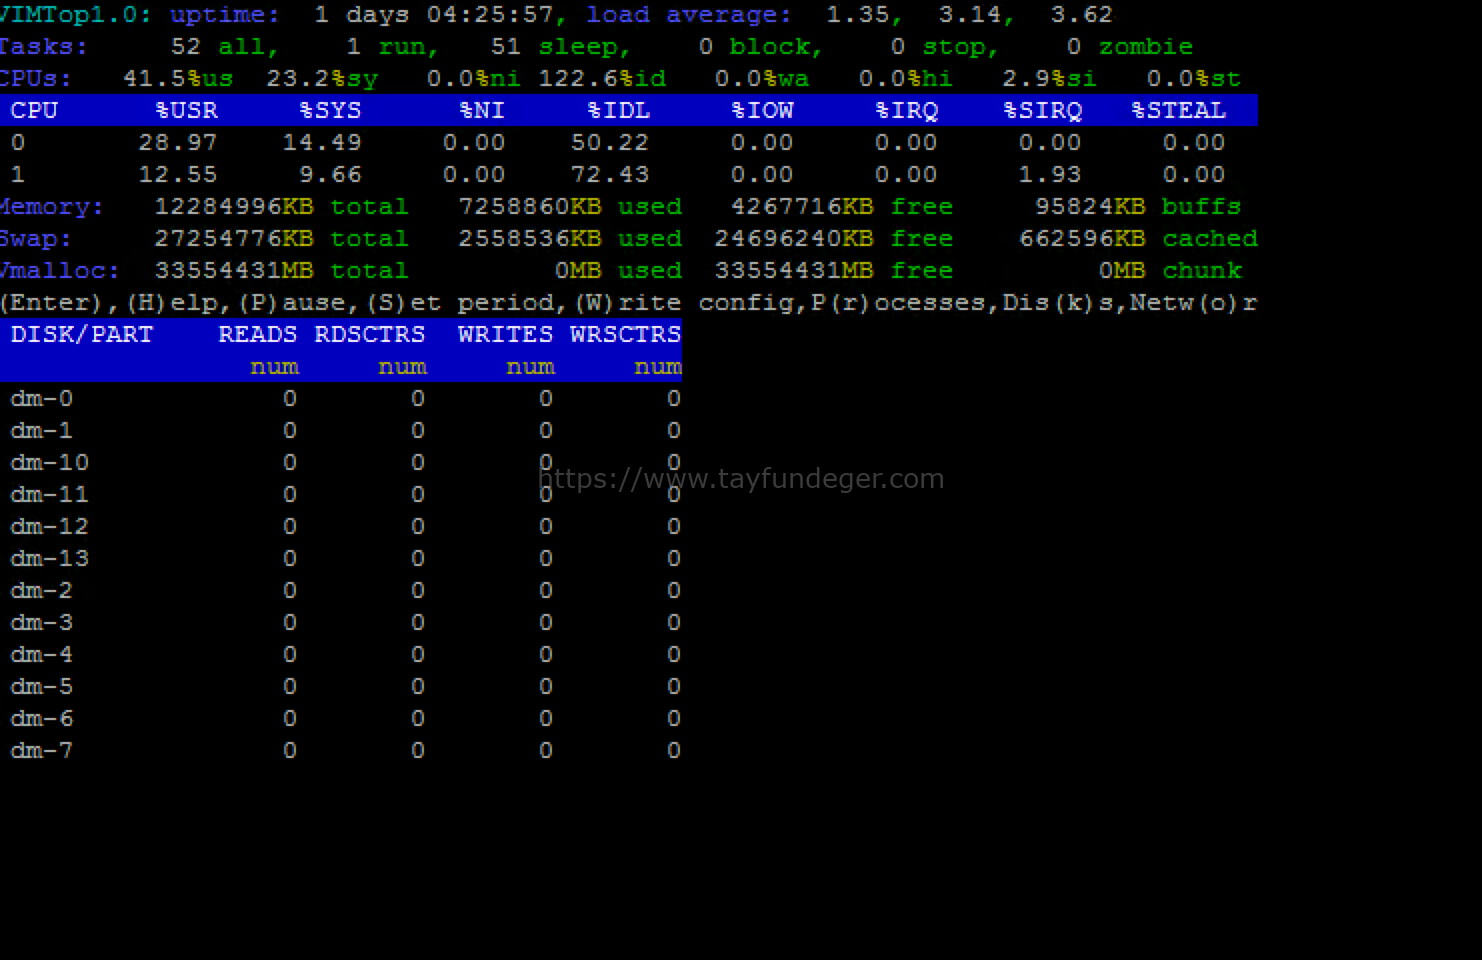
k butonua bastığınızda vCenter Server üzerinde yer alan disklerin okuma yazma oranlarının detaylarını görebiliriniz. Burada yine yön veyukrı aşağı ok tuşlarını kullanarak diskleri highlight edebilirsiniz. d butonuna bastığınızda en fazla okuma yazma yapan diski en yukarıya alabilir veya en aşağıya alabilirsiniz.
Isterseniz burada c butonuna basarak daha fazla parametreyi izleyebilirsiniz.
| Column Name | Description |
| DISK/PART | Storage disk identifier / Disk partition identifier |
| IOS | Number of I/O operations currently in progress on this partition (should go to zero) |
| IOTIME | Milliseconds spent doing I/O operations on this partition (increases or a nonzero number of I/O operations) |
| LAT | Partition access latency (in milliseconds) calculated using the total amount of time spend doing I/O divided by the total amount of I/O oprations, done during last measurement interval / Disk access latency (in milliseconds) calculated using the total amount of time spend doing I/O divided by the total amount of I/O operations, done during last measurement interval |
| READS | Number of reads issued to this partition and completed successfully during last measurement interval |
| RDMRG | Adjacent to each other reads on this partition, merged for efficiency / Adjacent to each other reads on this, merged for efficiency |
| READ | Number of reads per second issued to this partition / Number reads per second issued to this disk |
| RDSCTRS | Number of sectors read successfully from this partition during last measurement interval / Number of sectors read successfully from this disk during last measurement interval |
| WRITES | Number of writes issued to this partition and completed successfully during last measurement interval / Number of writes issued to this disk and completed successfully during last measurement interval |
| WRMRG | Adjacent to each other writes on this partition, merged for efficiency / Adjacent to each other writes on this disk, merged for efficiency |
| WRITE | Number of writes per second issued to this partition / Number of writes per second issued to this disk |
| WRSCTRS | Number of sectors wrote successfully to this partition during last measurement interval / Number of sectors wrote successfully to this disk during last measurement interval |
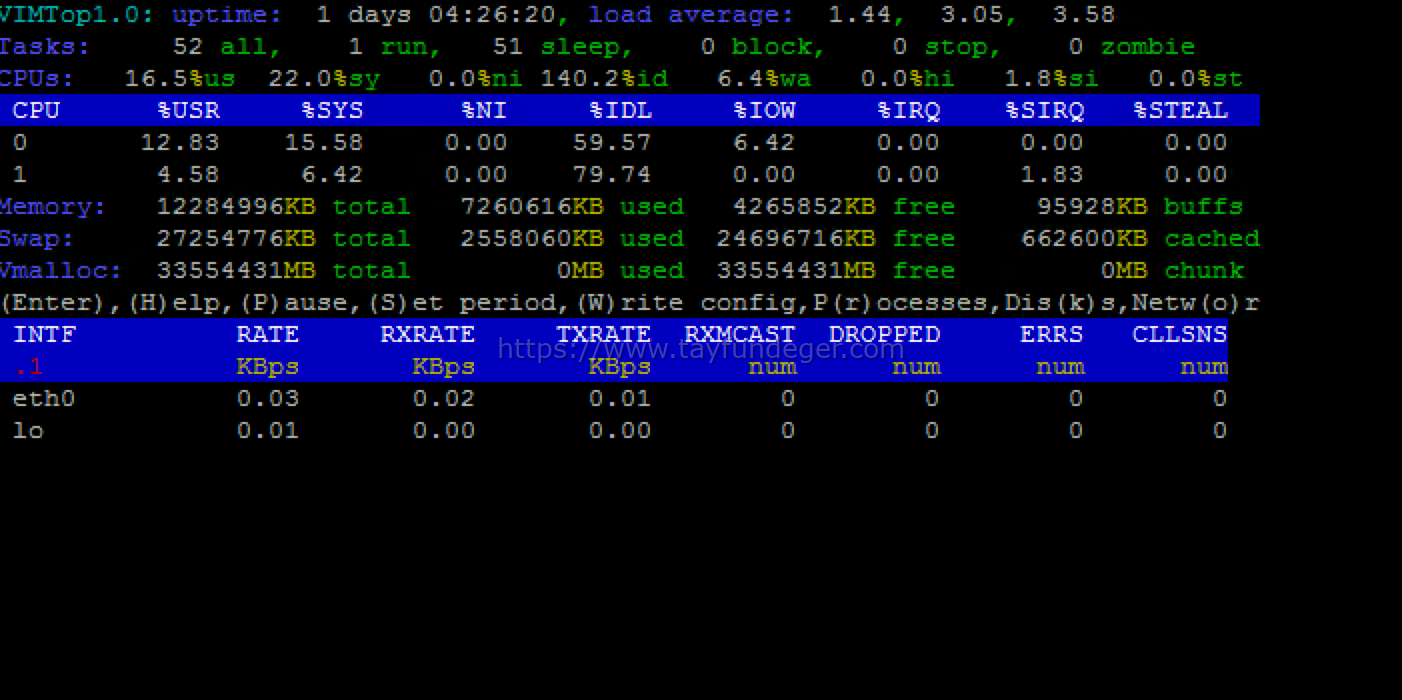
o butonuna bastığınızda vCenter Server’in network kartlarını ve bunların detaylarını görebilirsiniz. Burada RXRATE ve TXRATE bölümünden inbound – outbound network trafiğinin detayını görebilirsiniz.
Yine bu ekranda da c butonuna bastığınızda farklı değerleri ekleyebilir ve izleyebilirsiniz.
| Column Name | Description |
| TRGPT | Total throughput of this interface (Rx + Tx) in kilobytes |
| RATE | The activity of this network interface in kBps |
| RXED | Amount of data (in kilobytes) received during last measurement interval |
| RXRATE | Rate of received data through this interface in kBps |
| TXED | Amount of data (in kilobytes) transmitted during last measurement interval |
| TXRATE | Rate of data transmission through this interface in kBps |
| RXMCAST | Number of multicast packets received on this interface during last measurement interval |
| RXDROP | Number of data rx-packets dropped during last measurement interval |
| TXDROP | Number of data packets dropped upon transmission during last measurement interval |
| DROPPED | Number of dropped packets through this network interface because of running out of buffers during last measurement cycle |
| ERRS | Total number of faults (Tx and Rx) on this interface rface |
| RXERRS | The sum of receive errors, rx-fifo errors and rx-frame errors |
| TXERRS | The sum of transmit errors, tx-fifo errors and carrier errors |
| FIFOERRS | FIFO overrun errors on this interface caused by host being busy to serve the NIC hardware |
| CLLSNS | Collisions detected on the transmission medium |
Dikkat ettiyseniz vimtop’u esxtop makalesi kadar geniş anlatmadım çünkü bu bölümü aktif olarak kullanacağınızı düşünmüyorum. vCenter Server ile birlikte gelen Photon OS zaten çok performanslı çalışan bir işletim sistemi. Bundan dolayı işletim sistemi kaynaklı ciddi performans problemleri veya sorunlar yaşamazsınız. Ancak altyapınızdan kaynaklı bir darboğaz veya sıkıntı var ise ozaman yapacak bir şey maalesef bulunmuyor:)
vimtop ile vCenter Server üzerindeki performans verilerini izleyebilir bunları isterseniz yorumlayabilirsiniz. vCenter Server ve vimtop isimli makalemde anlatacaklarım bu kadar:)
Umarım faydalı olmuştur.
İyi çalışmalar.